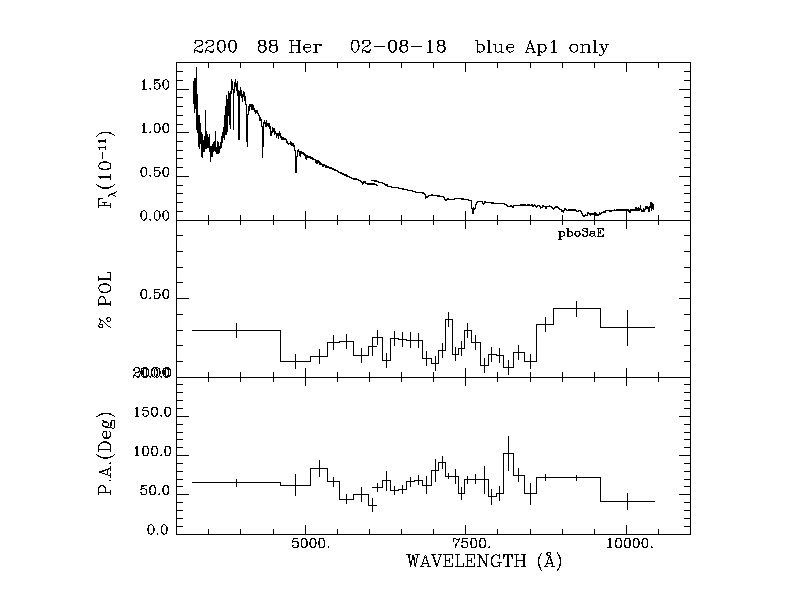
NOTES:
For data that has a TRIPLOT available, you can view that triplot by clicking on the date, or the TRIPLOT button in the far right column of the data.
Data listed in RED should be considered preliminary results only.
Filter data listed in
this color
represent bandpasses that include a falloff in instrument response.
(See the descriptions of Wav1 and Wav2
for grating cutoff versus filter bandpasses.)
| Target | Date | MJD | ExpT | Wav1 | Wav2 | %Q | %U | %Err | %Pol | PA | Pub | Cal | Comments | Triplot |
|---|---|---|---|---|---|---|---|---|---|---|---|---|---|---|
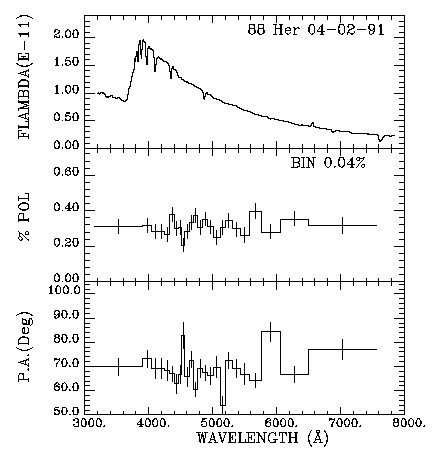
| 88-Her | 19910402 | 48348.29 | 6554 | 3159.0 | 7569.0 | -0.2233 | 0.2076 | 0.0081 | 0.3049 | 68.540 | C2 | pbo2c5 | _ | Triplot |
| UX | UX | -0.1759 | 0.1591 | 0.0277 | 0.2372 | 68.932 | ||||||||
| B | B | -0.2315 | 0.2047 | 0.0053 | 0.3090 | 69.257 | ||||||||
| V | V | -0.2150 | 0.2265 | 0.0063 | 0.3123 | 66.752 | ||||||||
| R | R | -0.2515 | 0.2105 | 0.0111 | 0.3280 | 70.033 | ||||||||
| I | I | -0.2590 | 0.1444 | 0.0606 | 0.2965 | 75.430 | ||||||||
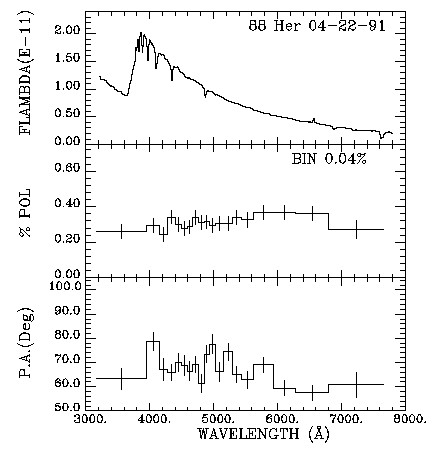
| 88-Her | 19910422 | 48368.17 | 4915 | 3171.0 | 7665.0 | -0.2154 | 0.2199 | 0.0091 | 0.3079 | 67.210 | C2 | pbo2c5 | _ | Triplot |
| UX | UX | -0.1395 | 0.1053 | 0.0224 | 0.1747 | 71.477 | ||||||||
| B | B | -0.2325 | 0.2008 | 0.0066 | 0.3072 | 69.592 | ||||||||
| V | V | -0.2245 | 0.2346 | 0.0068 | 0.3247 | 66.871 | ||||||||
| R | R | -0.1896 | 0.2880 | 0.0098 | 0.3448 | 61.679 | ||||||||
| I | I | 0.0129 | 0.4357 | 0.0448 | 0.4359 | 44.150 | ||||||||
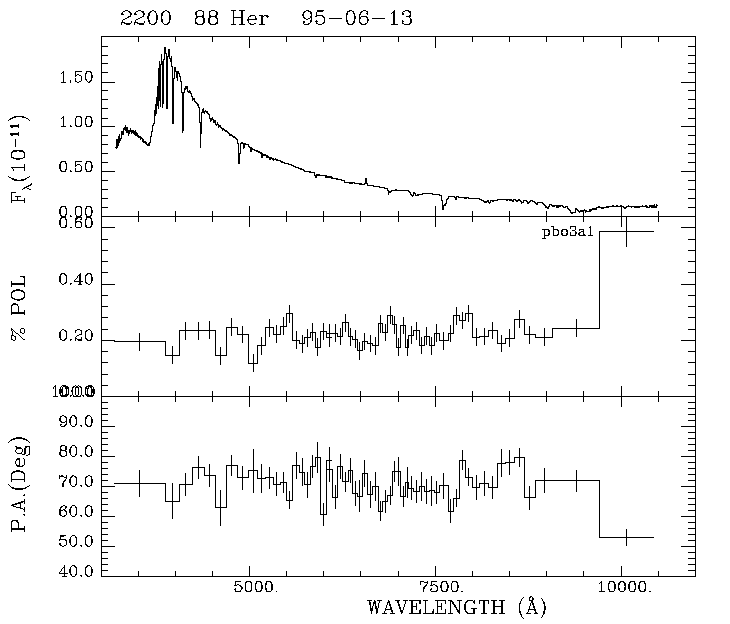
| 88-Her | 19950613 | 49881.77 | 3200 | 3175. | 6103. | -0.1700 | 0.1224 | 0.0065 | 0.2095 | 72.12 | _ | pbo3a1 | _ | Triplot |
| 88-Her | 19950613 | 49881.73 | 2560 | 6038. | 10434. | -0.1727 | 0.1429 | 0.0049 | 0.2242 | 70.20 | _ | pbo3a1 | _ | Triplot |
| UX | UX | -0.1305 | 0.1373 | 0.0189 | 0.1894 | 66.763 | ||||||||
| B | B | -0.1620 | 0.1233 | 0.0067 | 0.2036 | 71.367 | ||||||||
| V | V | -0.1716 | 0.1256 | 0.0049 | 0.2126 | 71.901 | ||||||||
| R | R | -0.1688 | 0.1302 | 0.0031 | 0.2132 | 71.172 | ||||||||
| I | I | -0.1798 | 0.1370 | 0.0036 | 0.2260 | 71.345 | ||||||||
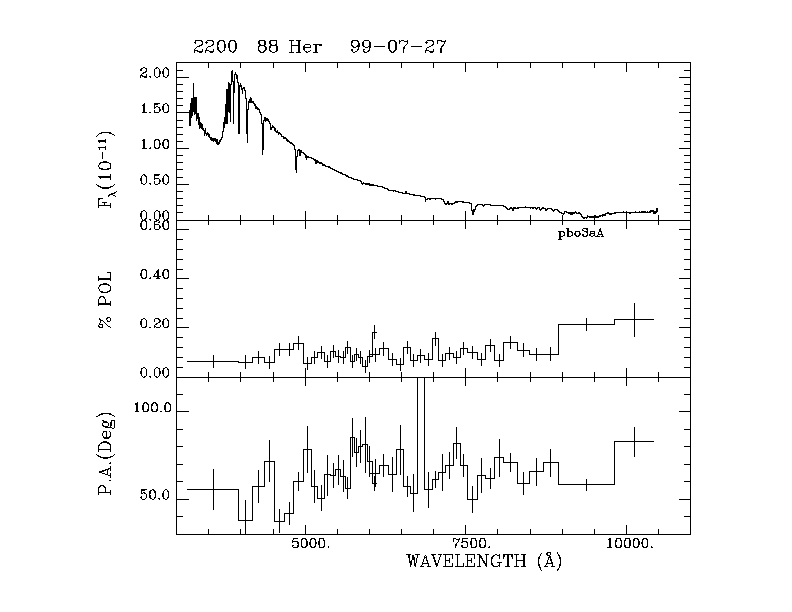
| 88-Her | 19990727 | 51386.67 | 6400 | 3175. | 6106. | -0.0444 | 0.0705 | 0.0054 | 0.0833 | 61.09 | _ | pbo3aA | _ | Triplot |
| 88-Her | 19990727 | 51386.63 | 2560 | 6014. | 10426. | -0.0589 | 0.0787 | 0.0053 | 0.0983 | 63.40 | _ | pbo3aA | _ | Triplot |
| UX | UX | -0.0080 | 0.1314 | 0.0219 | 0.1316 | 46.745 | ||||||||
| B | B | -0.0151 | 0.0803 | 0.0060 | 0.0817 | 50.312 | ||||||||
| V | V | -0.0514 | 0.0670 | 0.0040 | 0.0844 | 63.753 | ||||||||
| R | R | -0.0575 | 0.0663 | 0.0030 | 0.0878 | 65.453 | ||||||||
| I | I | -0.0663 | 0.0738 | 0.0038 | 0.0992 | 65.973 | ||||||||
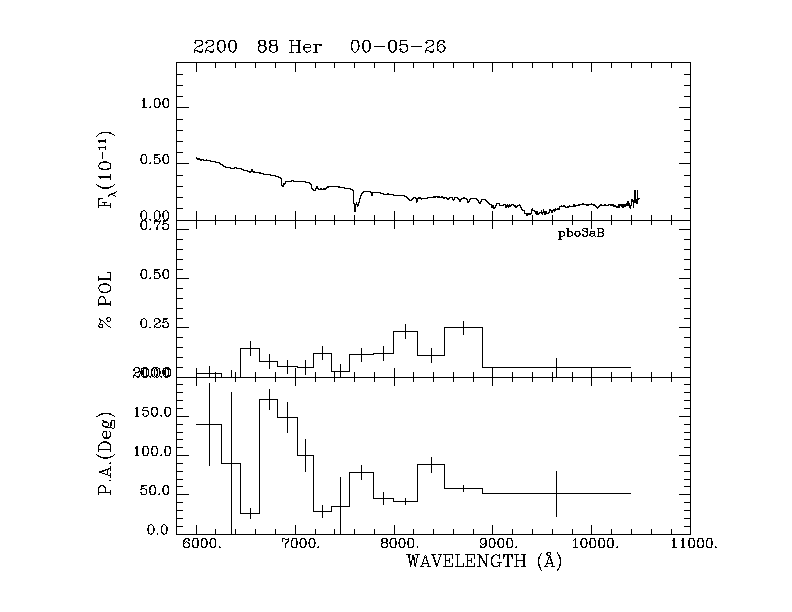
| 88-Her | 20000526 | 51690.64 | 2520 | 5998. | 10394. | -0.0044 | 0.0567 | 0.0095 | 0.0568 | 47.21 | _ | pbo3aB | cloudy;blue too low S/N | Triplot |
| UX | UX | _ | _ | _ | _ | _ | ||||||||
| B | B | _ | _ | _ | _ | _ | ||||||||
| V | V | _ | _ | _ | _ | _ | ||||||||
| R | R | 0.0253 | 0.0025 | 0.0068 | 0.0255 | 2.857 | ||||||||
| I | I | -0.0430 | 0.1112 | 0.0066 | 0.1192 | 55.566 | ||||||||
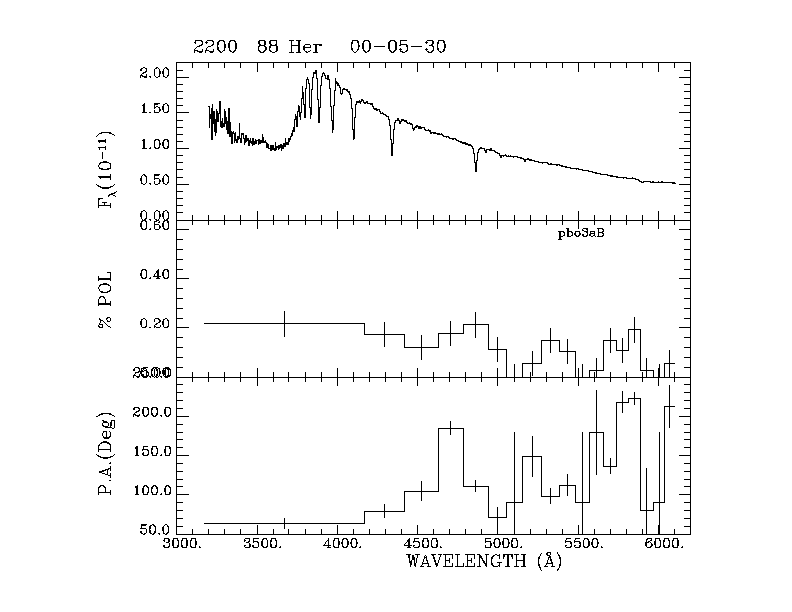
| 88-Her | 20000530 | 51694.68 | 3200 | 3175. | 6100. | -0.0310 | 0.0105 | 0.0117 | 0.0327 | 80.66 | _ | pbo3aB | blue only | Triplot |
| UX | UX | 0.3200 | -0.2024 | 0.0722 | 0.3786 | 163.847 | ||||||||
| B | B | -0.1393 | 0.0874 | 0.0151 | 0.1645 | 73.946 | ||||||||
| V | V | -0.0310 | -0.0162 | 0.0090 | 0.0349 | 103.809 | ||||||||
| R | R | _ | _ | _ | _ | _ | ||||||||
| I | I | _ | _ | _ | _ | _ | ||||||||
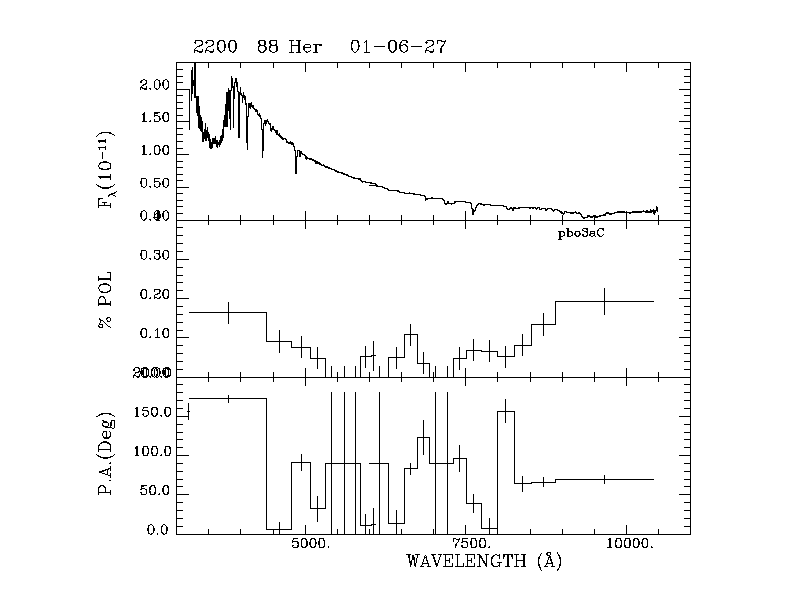
| 88-Her | 20010627 | 52087.67 | 6400 | 3175. | 6100. | 0.0292 | 0.0063 | 0.0092 | 0.0298 | 6.13 | _ | pbo3aC | _ | Triplot |
| 88-Her | 20010627 | 52087.63 | 2560 | 6006. | 10426. | -0.0199 | 0.0270 | 0.0076 | 0.0335 | 63.16 | _ | pbo3aC | _ | Triplot |
| UX | UX | 0.2851 | 0.0519 | 0.0621 | 0.2897 | 5.159 | ||||||||
| B | B | 0.1236 | -0.0270 | 0.0114 | 0.1265 | 173.843 | ||||||||
| V | V | -0.0057 | 0.0141 | 0.0066 | 0.0152 | 56.081 | ||||||||
| R | R | 0.0036 | 0.0127 | 0.0048 | 0.0132 | 37.052 | ||||||||
| I | I | -0.0098 | 0.0359 | 0.0052 | 0.0372 | 52.600 | ||||||||
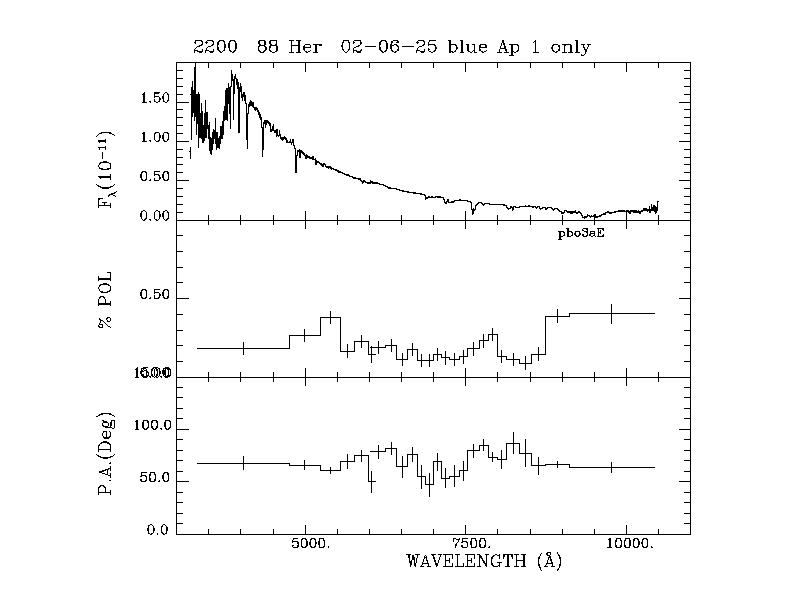
| 88-Her | 20020625 | 52450.70 | 3200 | 3322. | 6100. | -0.1526 | 0.1740 | 0.0169 | 0.2314 | 65.63 | _ | pbo3aE | blue:Ap1 only | Triplot |
| 88-Her | 20020625 | 52450.66 | 2560 | 6018. | 10434. | -0.1262 | 0.1036 | 0.0093 | 0.1632 | 70.30 | _ | pbo3aE | blue:Ap1 only | Triplot |
| UX | UX | 0.8366 | -0.1182 | 0.0928 | 0.8449 | 175.979 | ||||||||
| B | B | -0.1540 | 0.1684 | 0.0226 | 0.2282 | 66.218 | ||||||||
| V | V | -0.1891 | 0.2265 | 0.0119 | 0.2950 | 64.930 | ||||||||
| R | R | -0.1288 | 0.0931 | 0.0070 | 0.1589 | 72.064 | ||||||||
| I | I | -0.1316 | 0.0922 | 0.0062 | 0.1607 | 72.495 | ||||||||
| 88-Her | 20020818 | 52504.66 | 2600 | 3250. | 6106. | -0.0806 | 0.1520 | 0.0174 | 0.1721 | 58.97 | _ | pbo3aE | blue:Ap1 data only | Triplot |
| 88-Her | 20020818 | 52504.61 | 2400 | 6046. | 10434. | -0.1316 | 0.1374 | 0.0095 | 0.1902 | 66.87 | _ | pbo3aE | blue:Ap1 data only | Triplot |
| UX | UX | -0.3261 | 0.3299 | 0.1156 | 0.4639 | 67.331 | ||||||||
| B | B | -0.1886 | 0.2318 | 0.0231 | 0.2989 | 64.567 | ||||||||
| V | V | -0.0923 | 0.1200 | 0.0118 | 0.1514 | 63.783 | ||||||||
| R | R | -0.0851 | 0.1694 | 0.0073 | 0.1896 | 58.334 | ||||||||
| I | I | -0.1193 | 0.1224 | 0.0065 | 0.1709 | 67.127 |